How to dump user process
There are many ways to dump the user process. I introduce here some commonly used methods of how to dump a process.
A. Using ADPLUS
ADPLUS is the tool that Microsoft CSS often uses to take a dump. There are 2 dump modes in this tool - one for hang and the other for crash dump.HANG : to capture hang dump, you run ADPLUS with -hang option after hang occurred. It will take a dump and leave the process intact (meaning non-invasive dump). Need to specify -p with PID and -o with output folder.
C:\Debuggers> adplus -hang -p 433 -o c:\Test (PID=433)
Logs and memory dumps will be placed in c:\Test\20100127_111336_Hang_Mode
CRASH : the other ADPLUS mode is crash mode, which takes a dump when the process is crashed. Since we never know when the crash occurs, the ADPLUS command - of course - shoud be run before the crash occurs. If you're using remote connection (mstsc.exe) , you should use /console. Crash mode is very handy since adplus will wait until the crash occurs.
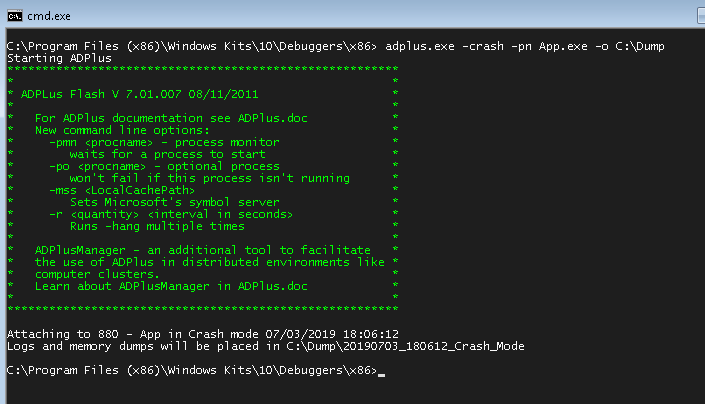
C:\Debuggers> adplus -crash -pn App.exe -o c:\test
Logs and memory dumps will be placed in c:\test\20100127_111828_Crash_Mode
ADPlus was originally written in VBScript, but they wrote Managed (.NET) EXE version in ADPlus v7.0. ADPlus internally uses CDB to capture dump.
ADPlus is in the same directory as where the windbg.exe is. ADPlus is include in "Debugging Tools for Windows" which typically can be installed from Windows SDK. If installed from Windows SDK, default location for x86 version is C:\Program Files (x86)\Windows Kits\10\Debuggers\x86. The following picture is an example of crash dump using adplus.exe.
B. Using Windows Error Reporting (WER) Crash Dump
In latest Windows such as Windows 7, Windows 10, crash dumps can be created automatically by setting registry key.Under Windows Error Reporting(WER) registry key, create a registry key called LocalDumps. If this key exists, crash dump will be created when application is crashed.
HKEY_LOCAL_MACHINE\SOFTWARE\Microsoft\Windows\Windows Error Reporting\LocalDumps
If the key is not present, create new key. You will also need to reboot the machine.
By default crash dump will be mini dump. If you want full dump, add DumpType (DWORD) under LocalDumps and set the value to 2.
[DumpType (DWORD)]
0: Custom dump
1: Mini dump
2: Full dump
If you want to specify dump folder, use DumpFolder (REG_EXPAND_SZ) under LocalDumps key. The default value for DumpFolder is %LOCALAPPDATA%\CrashDumps.
C. Using CDB
CDB is console based general purpose debugging tool and it's also good tool to dump a process.When dumping a process, we normally want to be "non-invasive" which means we don't want to ruin the process and just take a snapshot of the process. This can be done by specifying -pv option. This method is not for taking crash dump, but for taking a current snapshot of the process.
If the process name is unique, you can use -pn option with exe file name. But if there are several processes having the same process name, typically we check process PID of interest and use -p option. The -c option below is actual debugger command that the CDB is going to run. The .dump command below dumps the process to specified file.
C> cdb -pv –pn myApp.exe -c ".dump /ma /u c:\tmp\myApp.dmp;q"
C> cdb -pv –p 500 -c ".dump /ma c:\tmp\myApp.dmp;q"
D. Using Task Manager
Since Vista OS, Task Manager (taskmgr.exe) has new context menu called "Create Dump File." In order to create a dump for the specific process, you select a process and rightclick and then choose 'Create Dump File" menu. Here is an example of Windows 7 Task Manager. After dumping is done, it shows the dumpe file location in the message box.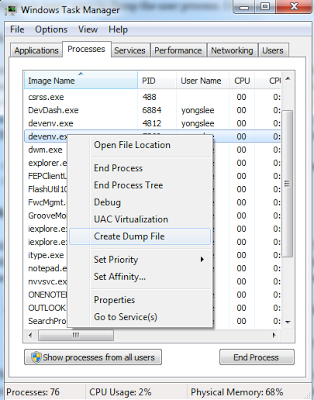
Create Dump File From Task Manager
If the target process is 64bit, use "64bit Task Manager" located on C:\Windows\System32\taskmgr.exe
and for 32bit process, use "32bit Task Manager" located on C:\Windows\SysWOW64\taskmgr.exe.