How to use WinDbg
To get a first overview about how to use WinDbg, let's look at a simple case.
-
In Start menu, type WinDbg and choose "WinDbg (x86) or WinDbg (x64)."
If the target application (debuggee) is 32bit x86, use WinDbg (x86); and for 64bit x64 application, use WinDbg (x64).
Alternatively, WinDbg.exe can be found in one of these dirctories (in case of Windows SDK 10).
C:\Program Files (x86)\Windows Kits\10\Debuggers\x64  (64bit version)
C:\Program Files (x86)\Windows Kits\10\Debuggers\x86  (32bit version)
- Select [File] - [Open Executable] menu. In [Open Executable] dialog, type "C:\Windows\System32\calc.exe". WinDbg will start calculator but stop immediately to allow debugger to control the calculator.
-
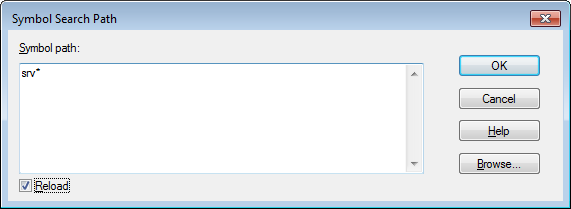
Select [File] - [Symbol File Path] menu. Type "srv*" and check Reload.
This will define Symbol path and reload symbols.

-
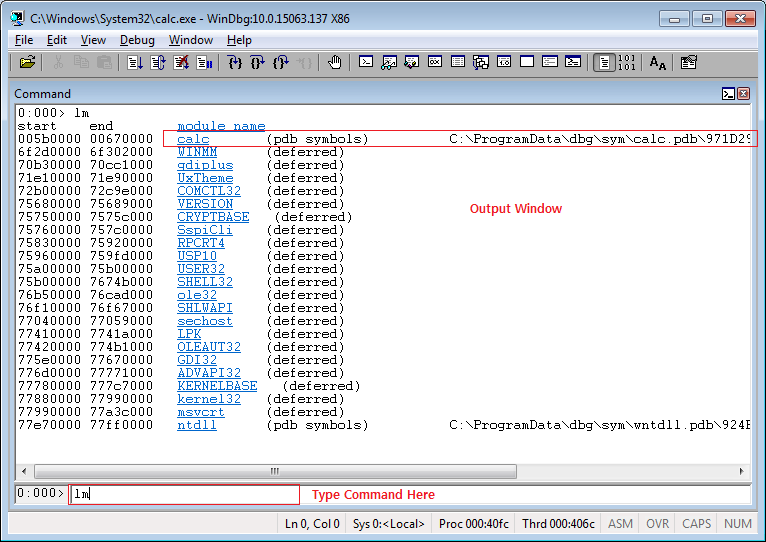
Type "lm" (list module) command in input command window. Result will be shown in output window.

- Type "g" (go) command in input command window. This will make the calculator running and then the calc dialog will be shown.
- In WinDbg, click Break toolbar (Ctrl+Break) on top. This will freeze calculator application and WinDbg will take control again.
- Type "k" (call stack) to view call stack. (There are many WinDbg commands to learn...)
- type "q" (quit) to quit application process. This will close calc process, not WinDbg.