How to attach debugger
Debuggee is an application process that is controlled by debugger. Debugger such as WinDbg can pause the debuggee process, execute line by line, and investigate its memory data.
By and large, WinDbg has 5 different ways of debugging.
And here are 3 common ways of attaching WinDbg to user process.
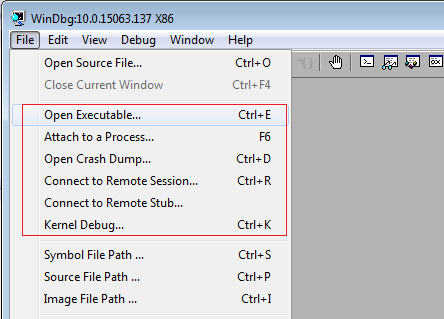
Open Executable
Launch WinDbg, select [File] - [Open Executable] menu, and then choose any EXE file you want to debug. This approach is used when creating new process within debugger.
Attach Existing Process
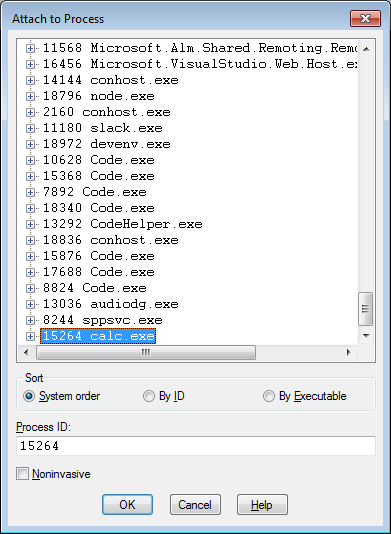
If a debuggee process is already running, debugger should attach to the debuggee process.
Launch WinDbg, select [File] - [Attach to a Process] menu, and then choose a process you want to debug.
Open Dump File
Both methods above are used for live process, but live process is not always available for debugging. In that case, dump file can be used as an alternative way. Dump file whose file extention is typically .dmp, can be created when crash occurred or manually. When a dump file is available, launch WinDbg, select [File] - [Open Crash Dump] menu, and then choose a dumpe file you want to debug.
WinDbg Command-line
Instead of using WinDbg UI, one can use command-line as below. Let's assume the WinDbg.exe is in the PATH.
- Open Executable : will create new calc process
C:\> windbg Calc.exe
- Attach Existing Process : first find PID using tlist or task manager and then use -p option in WinDbg
C:\> tlist -p calc.exe
9672

C:\> windbg -p 9672
- Dump File : use -z option to open dump file
C:\> windbg -z c:\temp\calc.dmp